Market Navigation Reports

Monthly multi-asset Market Navigation research reports to help investment decision
formulation, covering global markets performance and market drivers and trends

Global Markets Performance - May 2024

4.7%

May return of FT Wilshire 5000 (TR)

10.1%

YTD return of FT Wilshire 5000

The FT Wilshire 5000 has recovered April’s losses but momentum eases towards month end

Short Term Returns

FT Wilshire 5000 short term returns

Long Term Returns

FT Wilshire 5000 long term returns
Source: Wilshire Indexes
Data as of:
May 31, 2024

14.3%

Technology sector return in May 2024

-10.7%

Transportation sector return YTD

Technology rebounded and outperformed in May delivering strong double-digit returns

Sector Returns

FT Wilshire Index Sector Returns

Sector-Weighted Contribution

FT Wilshire Index sector-weighted contribution to returns
Source: Wilshire Indexes
Data as of:
May 31, 2024

14.1%

Growth return YTD

+7.7%

Value return YTD

Growth continues to outperform Value. Large Cap delivers over twice the returns of Small Cap YTD.

Short and Long-Term Returns

FT Wilshire short and long-term returns

FT Wilshire long term relative returns

Longer-Term Relative Returns (Growth/Value and Large/Small)

FT Wilshire long term relative returns
Source: Wilshire Indexes
Data as of:
May 31, 2024

18.4%

Pure Momentum return YTD

15.5%

Pure Value return YTD

Market recovery sees Momentum regain leadership. Value significantly outperforming Quality so far in 2024.

1M vs YTD 2024

Absolute time series

Source: Wilshire Indexes
Data as of:
May 31, 2024

5.7%

May 2024 return of Europe ex UK equities (USD, TR)

1.2%

May 2024 return of Japan equities (USD, TR)

Global equities recovered in May led by Europe ex UK

Regional Time Series

Country Level Returns

Source: Wilshire Indexes
Data as of:
May 31, 2024

14.2%

US Technology return in May 2024

5.0%

Global ex US Technology return in May 2024

Superior technology contribution drives US outperformance in May

Regional sector returns and weights

FT Wilshire short and long-term returns

Regional sector-weighted contribution

FT Wilshire short and long-term returns
Source: Wilshire Indexes
Data as of:
May 31, 2024

63bps

YTD rise in US 10-year yield

-2.6%

YTD return of US 7-10yr govt bonds (TR)

US yields rise on fading rate cut expectations. Japanese 10-year yield rises above 1% for the first time since 2012.

7-10 year government bond returns

Investment grade and high yield returns

Yields and Decomp

Source: FactSet
Data as of:
May 31, 2024

3.3%

YTD rise DXY dollar index

-9.5%

YTD decline in JPY vs USD

The dollar loses some momentum in May. Spike in Japanese bond yields fails to stem the decline in the Yen.

Moves vs USD

Trade Weighted

Source: LSEG Datastream
Data as of:
May 31, 2024

12.8%

YTD rise in the gold price

-5.9%

Decline in the oil price (Brent Crude) in May

Gold and silver prices continue to shine. Oil prices retreat from recent April highs.

Commodity Time Series

Commodities over 2 time periods

Source: Wilshire Indexes, LSEG Datastream
Data as of:
May 31, 2024

5.1%

Wilshire US REIT return in May 2024

2.3%

Wilshire Liquid Alt Equity Hedge return in May 2024

US REITs outperform in May led by rebound in Industrials sector

REITS Performance

Liquid Alternative Investments

Source: Wilshire Indexes
Data as of:
May 31, 2024

14.6%

FT Wilshire Digital Assets Index return in May 2024

59.7%

YTD return of FT Wilshire Digital Assets Index

The FT Wilshire Digital Assets Index saw a strong recovery in May

Constituent Returns

Source: Wilshire Indexes, FactSet, CryptoCompare
Data as of:
May 31, 2024

FT Wilshire Market Drivers - July 2024

Keeping rates well above the neutral level now starting to slow US economic momentum

Data as of :
July 22, 2024

The pace of upward revisions to consensus US 2024 GDP forecasts has slowed markedly in recent months.

Markets increasingly confident it’s ’job done’ on inflation but services could still be too sticky for the Fed.

US 2024 GDP forecasts are still above the relatively weak growth outlook across other developed regions…
…but the momentum behind upgrades to consensus US 2024 GDP forecasts has slowed notably in recent months
Markets were encouraged by further momentum behind US disinflation in June
US services inflation could still be too sticky for the Fed to be confident that its ‘job done’ just yet
Source: Wilshire Indexes, LSEG Datastream, FactSet and Federal Reserve. Data as of July 22, 2024.
No items found.

Growth’s outperformance relative to Value widens further. Small cap lose momentum in early 2024.

Data as of :
January 31, 2024

Growth has continued to outperform Value. Small cap has marginally outperformed large cap over three months but saw negative returns in January.

Growth sees a 5yr annualized return of 17.9% vs 10.7% for value.
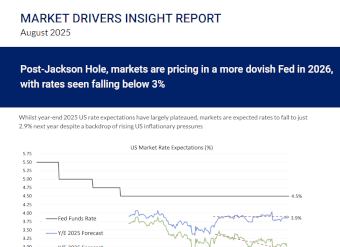
Markets pricing in higher tempo of rate cuts but US monetary policy facing a series of important milestones

Data as of :
July 22, 2024

Markets pricing in higher tempo of rate cuts but US monetary policy facing a series of important milestones including Powell’s guidance at August’s Jackson Hole Symposium, September’s FOMC meeting and the US presidential election.

Regional market and central bank interest rate expectations
Weaker economic data has led to Markets now pricing a higher tempo of US rate cuts through to June 2025
Areas of the US high yield market have come under pressure as a result of a period of prolonged higher US rates
Regional Monetary Cycle Barometers (MCB), 1-5 based on Z-scores
Source: Wilshire Indexes, LSEG Datastream, FactSet, Federal Reserve, BoE and ECB. Data as of May 20, 2024.

US market concentration drives divergence between US market aggregate and US ex ‘Mag 7’ 12m forward PEs

Data as of :
July 22, 2024

At 21.5 the US market 12m forward PE has risen its highest level since January 2022.

US market concentration drives divergence between US market aggregate and US ex ‘Mag 7’ 12m forward PEs.

Regional 12-month forward PE ratios
Divergence between aggregate US market and US ex ‘Mag 7’ 12 month forward PEs in recent months
Regional Valuation Metrics - Absolute vs 10-Year Average
Source: Wilshire Indexes, FactSet and LSEG Datastream. Data as of May 20, 2024.

US EPS growth remains highly dependent on tech sectors with breadth deteriorating across the rest of the US market

Data as of :
July 22, 2024

Technology sectors expected to contribute around two-thirds (8%) of the 12.1% forecast growth rate.

Regional consensus EPS growth forecasts
The delivery of US EPS growth in 2024 remains heavily dependence on technology sectors
Regional 12m forward EPS (rebased
US Analyst EPS Estimate Trails (USD)
Source: Wilshire Indexes and FactSet. Data as of May 20, 2024.

Latest Report

July 1, 2024

FT Wilshire 5000 delivers best H1 return in a US election year since 1976

Download
June 2024
By clicking “Accept All Cookies”, you agree to the storing of cookies on your device to enhance site navigation, analyze site usage, and assist in our marketing efforts. View our Privacy Policy for more information.
June 3, 2024

Tech stocks drive rebound in US market but rising bond yields generate valuation headwinds

Download
May 2024
By clicking “Accept All Cookies”, you agree to the storing of cookies on your device to enhance site navigation, analyze site usage, and assist in our marketing efforts. View our Privacy Policy for more information.
May 1, 2024

Reappraisal of US rate outlook injects volatility into markets. China closes in on a technical bull market.

Download
April 2024
By clicking “Accept All Cookies”, you agree to the storing of cookies on your device to enhance site navigation, analyze site usage, and assist in our marketing efforts. View our Privacy Policy for more information.
April 2, 2024

10% Rally in Q1 saw highest market concentration for over 40 years dominated by contribution from Nvidia

Download
March 2024
By clicking “Accept All Cookies”, you agree to the storing of cookies on your device to enhance site navigation, analyze site usage, and assist in our marketing efforts. View our Privacy Policy for more information.
March 1, 2024

AI-stock exuberance drives FT Wilshire 5000 to new highs

Download
February 2024
By clicking “Accept All Cookies”, you agree to the storing of cookies on your device to enhance site navigation, analyze site usage, and assist in our marketing efforts. View our Privacy Policy for more information.
February 1, 2024

Markets lose momentum as Fed dampens optimism over March rate cut. China continues to see sizeable declines.

Download
January 2024
By clicking “Accept All Cookies”, you agree to the storing of cookies on your device to enhance site navigation, analyze site usage, and assist in our marketing efforts. View our Privacy Policy for more information.
January 2, 2024

FT Wilshire 5000 delivers 6th best annual return since 2000

Download
December 2023
By clicking “Accept All Cookies”, you agree to the storing of cookies on your device to enhance site navigation, analyze site usage, and assist in our marketing efforts. View our Privacy Policy for more information.
December 4, 2023

Risk appetite returns as peak rate optimism drives market rebound

Download
November 2023
By clicking “Accept All Cookies”, you agree to the storing of cookies on your device to enhance site navigation, analyze site usage, and assist in our marketing efforts. View our Privacy Policy for more information.
November 1, 2023

Risk aversion comes to the fore as rising bond yields and geopolitical concerns drive declines across global equity markets.

Download
October 2023
By clicking “Accept All Cookies”, you agree to the storing of cookies on your device to enhance site navigation, analyze site usage, and assist in our marketing efforts. View our Privacy Policy for more information.
October 2, 2023

Surging US bond yields thwart the equity market rally in Q3, oil price spikes to 10 month high on tightening supply.

Download
September 2023
By clicking “Accept All Cookies”, you agree to the storing of cookies on your device to enhance site navigation, analyze site usage, and assist in our marketing efforts. View our Privacy Policy for more information.
September 6, 2023

August sees heightened volatility on rising bond yields and Chinese growth concerns but YTD equity returns remain strong

Download
August 2023
By clicking “Accept All Cookies”, you agree to the storing of cookies on your device to enhance site navigation, analyze site usage, and assist in our marketing efforts. View our Privacy Policy for more information.
August 2, 2023

Further signs of falling inflation help broaden and maintain market rally as ‘unloved’ sectors outperform in July

Download
July 2023
By clicking “Accept All Cookies”, you agree to the storing of cookies on your device to enhance site navigation, analyze site usage, and assist in our marketing efforts. View our Privacy Policy for more information.
July 5, 2023

Strong finish to the second quarter as market rally broadens out

Download
June 2023
By clicking “Accept All Cookies”, you agree to the storing of cookies on your device to enhance site navigation, analyze site usage, and assist in our marketing efforts. View our Privacy Policy for more information.
June 5, 2023

Technology stocks continue to dominate US equity returns; AI and Semiconductors the clear winners

Download
May 2023
By clicking “Accept All Cookies”, you agree to the storing of cookies on your device to enhance site navigation, analyze site usage, and assist in our marketing efforts. View our Privacy Policy for more information.
May 5, 2023

UK equities the standout performer in April. US sees modest rotation from growth into value last month.

Download
April 2023
By clicking “Accept All Cookies”, you agree to the storing of cookies on your device to enhance site navigation, analyze site usage, and assist in our marketing efforts. View our Privacy Policy for more information.
April 4, 2023

Markets rebound in late March as bank contagion fears ease

Download
By clicking “Accept All Cookies”, you agree to the storing of cookies on your device to enhance site navigation, analyze site usage, and assist in our marketing efforts. View our Privacy Policy for more information.

Monthly Analysis of global multi-asset absolute and relative FX- adjusted returns. Risk/Return analysis, correlation and Pure Factors.

Global Multi-Asset Returns

Global Multi-Asset Analysis of absolute and relative FX-adjusted returns.

FT Wilshire 5000

US Performance, sector contribution, technical analysis, dispersion.

Pure Factors

Return analysis, comparing Factor vs Style,

Global Equity

Regional multi-currency performance, sector comparison, technical analysis.

Additional asset classes

Fixed income, alternatives, foreign exchange.

Risk/Return analysis

Regional and multi-asset, multiple time periods.
By clicking “Accept All Cookies”, you agree to the storing of cookies on your device to enhance site navigation, analyze site usage, and assist in our marketing efforts. View our Privacy Policy for more information.

Latest Report

July 22, 2024

Prolonged period of above neutral interest rates is now impacting US economic momentum

July 2024
Download
July 2024
July 2024
June 24, 2024

The conundrum for the Fed: What nominal GDP regime and what neutral interest rate regime is the US economy facing?

June 2024
Download
June 2024
June 2024
May 22, 2024

Risk appetite recovers on easing financial conditions

May 2024
Download
May 2024
May 2024
April 24, 2024

Rapid reversal in US interest rate outlook generates heightened market volatility

April 2024
Download
April 2024
April 2024
March 21, 2024

Risk appetite encouraged by Fed lending conviction to the expectation that easing will commence in June

March 2024
Download
March 2024
March 2024
February 21, 2024

Markets weigh up AI trade vs waning rate cut optimism

February 2024
Download
February 2024
February 2024
January 24, 2024

Will US EPS growth take the baton as a key market driver?

January 2024
Download
January 2024
January 2024
November 15, 2023

The 2024 market outlook ‘Magnificent 7’ wish list

November 2023
Download
November 2023
November 2023
October 19, 2023

Despite near term US economic momentum the key question is what outlook are markets pricing in for 2024?

October 2023
Download
October 2023
October 2023
September 22, 2023

Reassessment of the US interest rate trajectory for 2024 implies maintenance of restrictive US financial conditions for the foreseeable future

September 2023
Download
September 2023
September 2023
August 16, 2023

Have markets become too complacent about a soft landing outcome?

August 2023
Download
August 2023
August 2023
July 20, 2023

Cooling inflation has buoyed risk appetite despite concerns that tight financial conditions could produce a double–dip

July 2023
Download
July 2023
July 2023
June 16, 2023

Equity risk appetite buoyed by debt ceiling resolution, disinflation trajectory and imminence of peak rates

June 2023
Download
June 2023
June 2023
May 18, 2023

First uptick in US EPS estimates in twelve months, but questions remain over the 2024 growth rate forecast

May 2023
Download
May 2023
May 2023
April 17, 2023

Markets rebound post-SVB as cooling inflation and weaker economic data keep market rate expectations anchored

Download

Analysis of trends in global growth, inflation, financial conditions, profits, valuation and sentiment cycles using our proprietary indicators

Market Driver Barometer

Movement and in-depth analysis of US Market Drivers.

Driver Pulse Sheets

Comprehensive data and analytics relating to the drivers across the regions.

In-depth coverage

Multi-asset returns, long perspectives, performance, and risk vs return analysis.
By clicking “Accept All Cookies”, you agree to the storing of cookies on your device to enhance site navigation, analyze site usage, and assist in our marketing efforts. View our Privacy Policy for more information.